SEO Analytics That Matter: Grow Faster Without Drowning in Useless Data
SEO Analytics That Matter: Grow Faster Without Drowning in Useless Data
Most people check Google Analytics, glance at their Search Console, and move on. Or worse, they track everything and understand nothing. Charts go up and down, but they have no idea what actually caused the change or what to do next.
This guide is different. It focuses on the small set of SEO analytics and actions that actually drive growth. No fluff, no vanity metrics: just a practical system for spotting what’s working, fixing what’s broken, and making smart decisions based on real data.
If you’ve ever wondered what to track, what to ignore, and how to improve your SEO without drowning in dashboards, you’re in the right place.
Because it shows how your site performs in Google’s eyes: impressions, clicks, rankings, and how users find you. It’s your front line of truth: what’s visible, what’s ignored, and what Google thinks your content is about. Here are key actions to check:a) Fix Pages with Low CTR (<1%)
If a page shows up often (high impressions) but barely gets clicks, something’s off, usually the title or meta description.
How to check:
1. Open Google Search Console
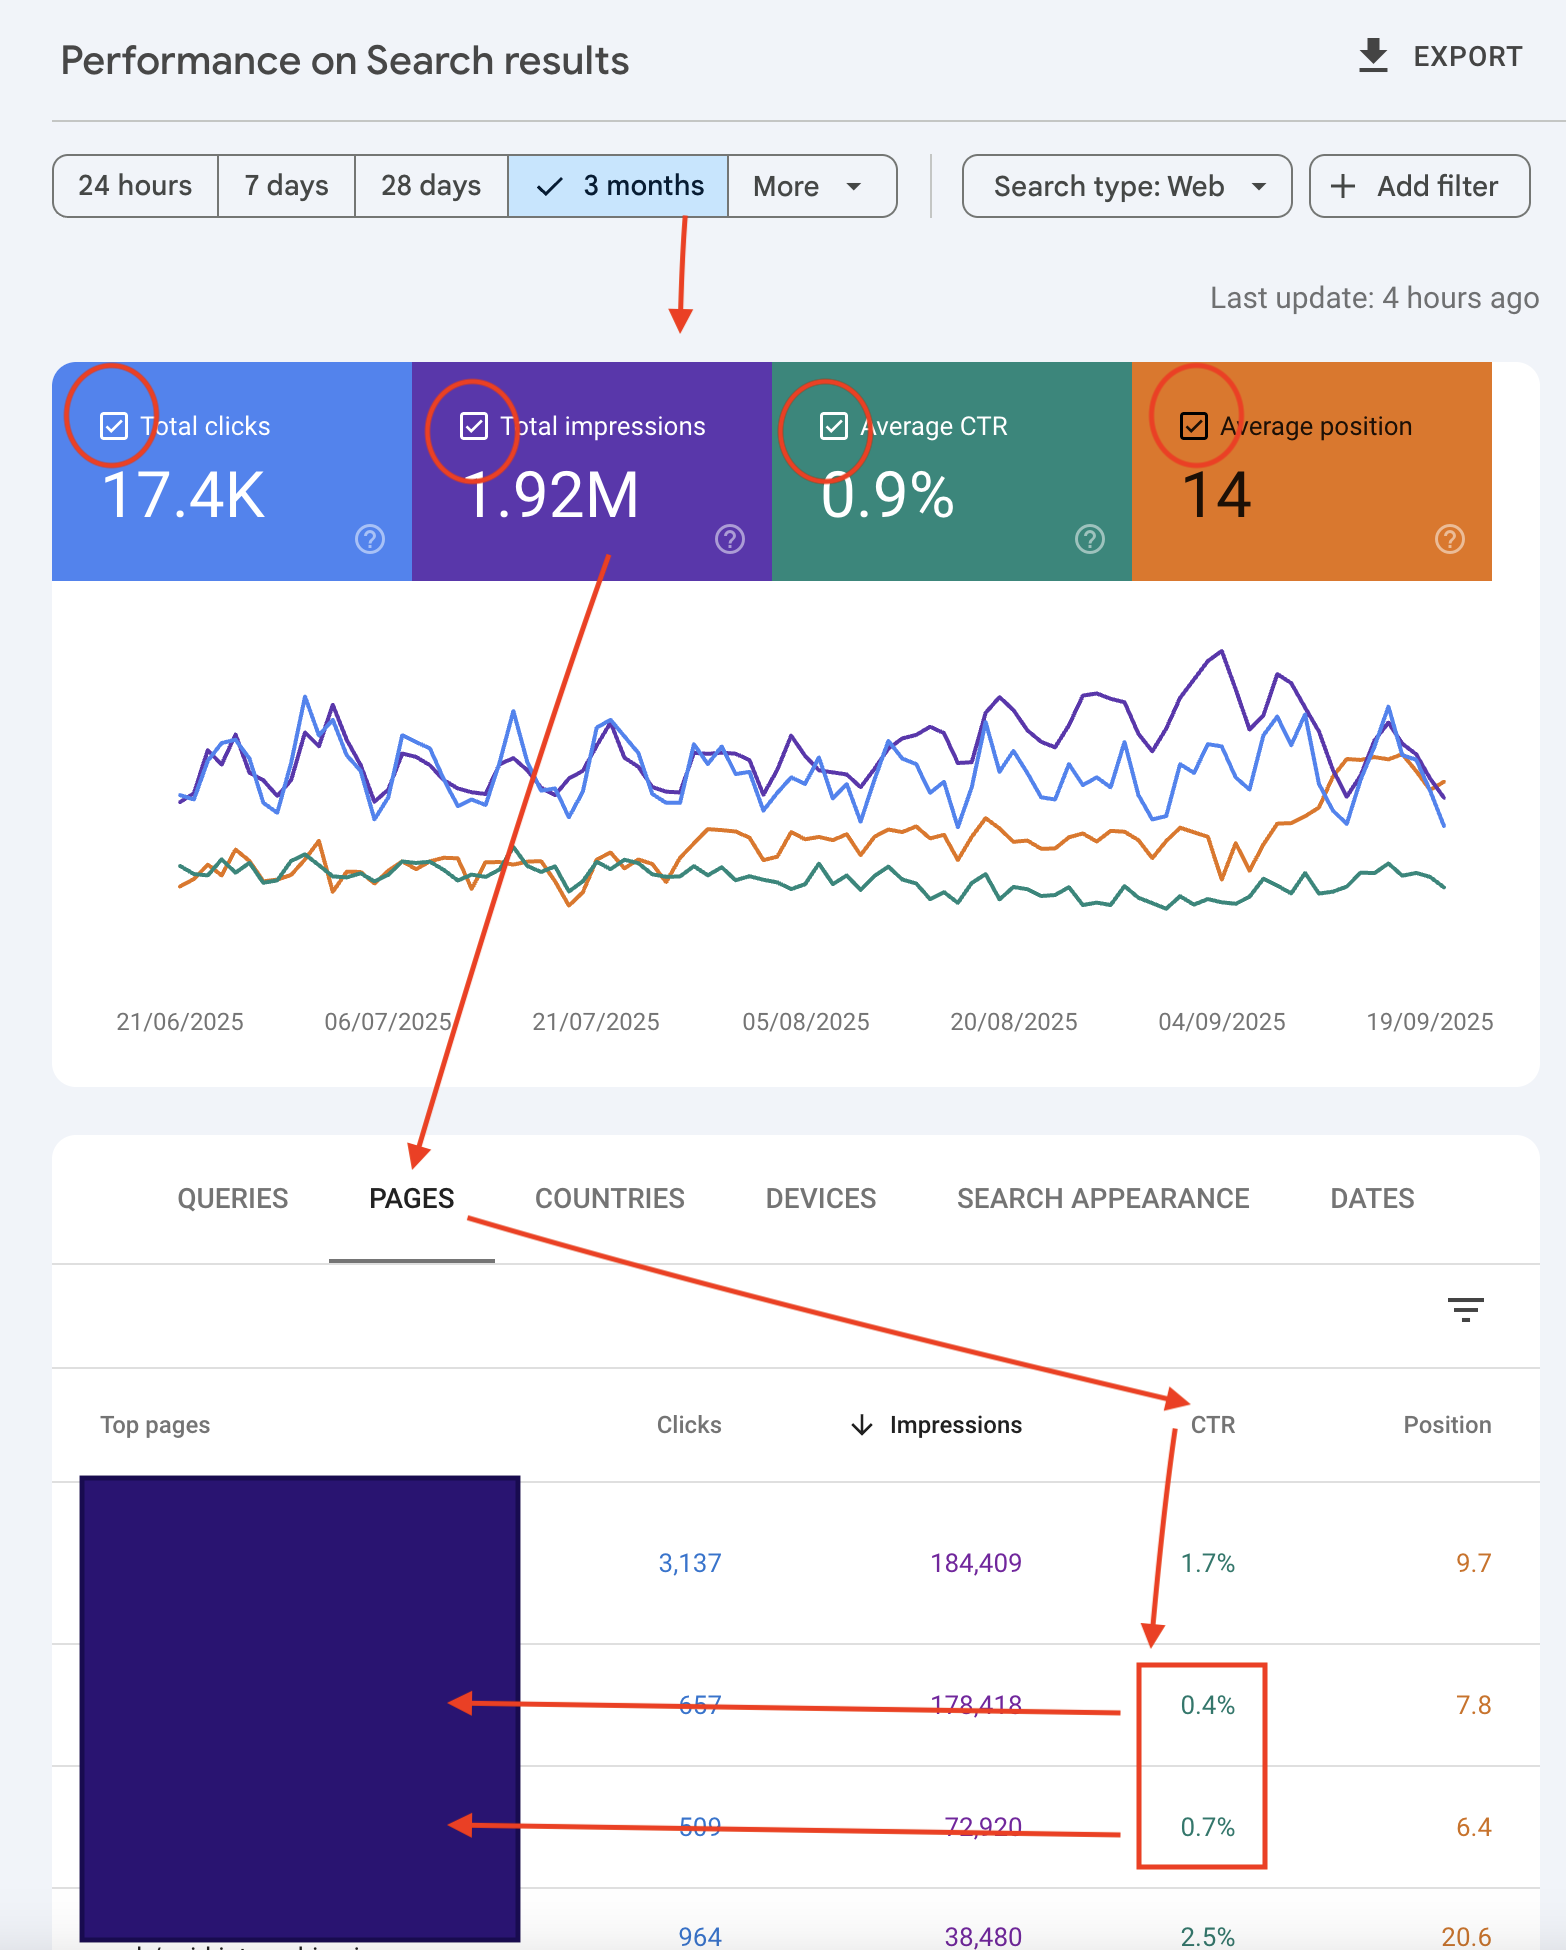
2. Go to Performance → Search results
3. At the top, change the date range to Last 3 months
4. Make sure all four metrics are selected: Total clicks, Total impressions, Average CTR, Average position.
5. Scroll down and open the “Pages” tab
6. In the CTR column, look for pages with high impressions but CTR under 1%
7. Click on one of those low-CTR pages
8. Switch to the “Queries” tab — this shows which search terms are bringing impressions to that page

What to do:
• Use those top queries to rewrite the page title and meta description so they match search intent more closely.
• Make the copy more clickable: use emotion, urgency, or direct benefits.
• Include exact keywords from the queries if possible.
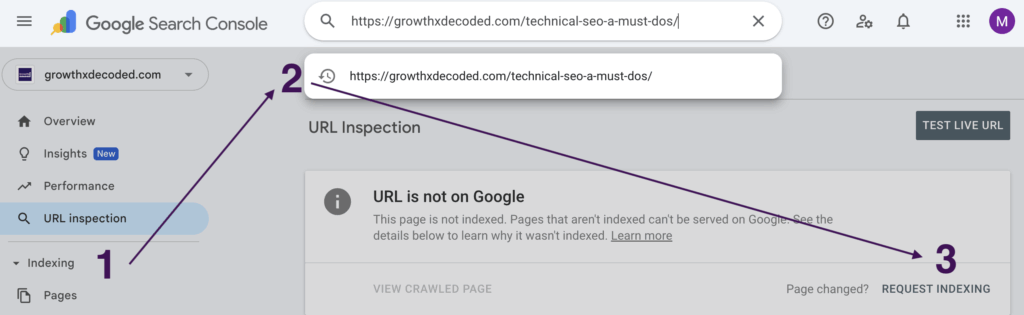
• Use the URL Inspection Tool to request indexing for your updated pages, like this:
b) Use Top Queries to Spot Opportunity
Your queries tab shows what real users typed to land on your page. Use it to tweak or expand content.
How to check:
• In Google Search Console, go to the Search Results section > Pages.
• Click on a page that gets a lot of clicks or impressions.
• Open the “Queries” tab to see what people searched to find this page.
What to do:
• Look for search queries with high impressions, clear intent, and low CTR that are closely related to your topic but not yet covered in your content.
• Add a short section, subheading, or FAQ that directly answers those queries.
• Use those keywords as the clickable text (anchor text) when linking from other pages on your site to this one.
• Optionally, include them in image alt text if relevant to visuals on the page.
c) Upgrade Pages Ranking #8–20
Pages sitting just outside the top 10 are already doing something right, they’re close. A few small updates can push them into the top 3, where 80% clicks happen.
How to check:
1. In Google Search Console, go to Performance → Search results
2. At the top, select the last 3 months and make sure Average position is turned on
3. Go to the “Queries” tab
4. Click the “Position” column to sort from low to high (or high to low)
5. Scroll through and manually look for queries ranking between 8 and 20
6. Click a promising query → then check which page ranks for it in the “Pages” tab
What to do:
• On that page, add a short section answering a “People Also Ask”–style question (e.g., “What’s the difference between cold and warm emails?”). These are short, practical questions that people type into Google.
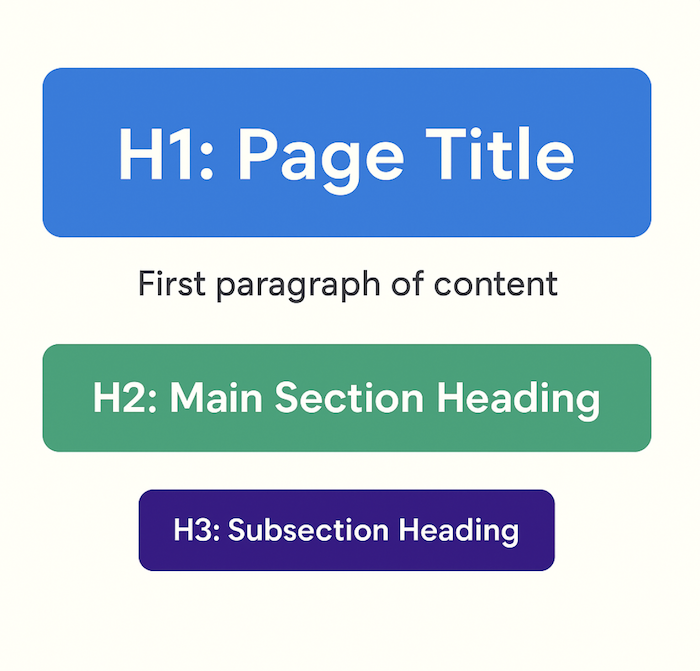
• Rewrite a subheading (H2 or H3) to include the exact keyword. H2s are main sections, H3s are sub-sections under them:
• Link to this page from 2–3 of your higher-authority pages (ones that already get good traffic or rank well) using the keyword as anchor text.
• Paste the URL into GSC’s URL Inspection Tool and click “Request Indexing” to trigger a re-crawl.
All of this – from fixing low CTRs to updating subheadings – forms your ongoing content refresh cycle that keeps traffic compounding.
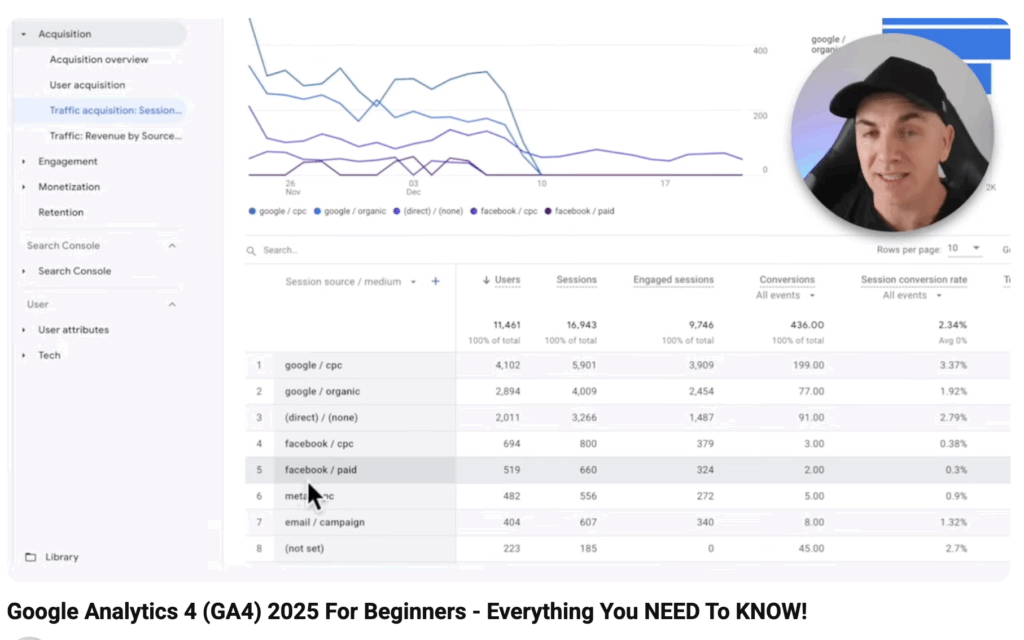
GA4 shows you what users actually do once they land on your site — how long they stay, what they click, and where they drop off. It’s your lens into user experience.Before you continue, if you’re not familiar with how to use Google Analytics, this is one of the best tutorials I’ve come across:
a) Engaged Sessions & Engagement Rate
Why it matters:

Engaged sessions tell you how many visitors actually interact with your content not just bounce away.
Engagement rate shows the % of sessions where people scrolled, clicked, or stayed more than 10 seconds. These are your truly interested users.
Where to check:
1. In GA4, go to Reports → Engagement → Pages and screens
2. At the top-right of the table, click the pencil icon ✏️ (Customize Report)
3. Click “Metrics” → then “Add metric”
4. Search for and add:
-Engaged sessions: an engaged session is when a visitor stays on your site for more than 10 seconds, clicks on something, or views more than one page. In another words, it means they didn’t just land and leave, they actually interacted.
-Engagement rate shows what % of all visits were engaged sessions. E.g. If your engagement rate is 60%, that means 6 out of 10 visitors interacted with your content.
5. Click Apply
6. You’ll now see those columns appear next to Views and Event Count.
What to do:
• If engagement rate is low (under 50%)
Visitors are landing but quickly losing interest. Rewrite your opening lines to clearly state what the page offers. Use short paragraphs, clear subheadings, and strong visual hierarchy to keep them scrolling.
• If some pages have high engagement and others don’t
Identify what’s working on the strong pages — headline style, tone, structure, visuals — and apply the same approach to weaker ones.
• If a page has a high number of engaged sessions
This is a strong content asset. Consider updating it regularly, adding internal links to other key pages, and even repurposing it into other formats (PDFs, videos, lead magnets, etc.)
b) Bounce Rate (Per Page)
Why it matters:

In GA4, bounce rate shows the percentage of visitors who landed on a page and left without doing anything meaningful: no clicks, no scrolling, no staying longer than 10 seconds.

Important: In GA4, bounce rate is reversed from the old Google Analytics:
-A high bounce rate means the user didn’t engage,
-A low bounce rate means the user did engage.
Where to check it:
1. In GA4, go to Reports → Engagement → Pages and screens
2. At the top right of the table, click the ✏️ Customize report icon
3. Under Metrics, click Add metric
4. Search for and add Bounce rate
5. Click Apply
6. Now, look under the “Bounce rate” column to see which pages lose visitors quickly
What to do with high bounce rate (>60%) pages:
• Check the intro: Is it clear, helpful, and aligned with the search intent? Rewrite the first 3–5 lines to make it obvious why someone should keep reading.
• Improve layout and readability: Break up large blocks of text, use subheadings, and add images or bullet points.
• Speed matters: If your page loads slowly, users may bounce before it even appears.
• Match the title to the content: If your page ranks for one thing but delivers something else, people will leave.
c) Conversion Events (CTA clicks, newsletter, etc.)
Why it matters:

It’s one thing to drive traffic, it’s another to know if that traffic does anything useful.

Most SEO visits are top-of-funnel - people are discovering you, not buying yet. That’s why your most important SEO conversions are usually small, low-friction actions like:

• Signing up as a registered users
• Subscribing to your newsletter
• Downloading a free resource
• Clicking a key CTA (like “Get the free guide” or “Try for free”)

racking these micro-conversions shows you which SEO pages don’t just get views but they deliver real value by bringing in new users.
How to check (and set up) in GA4:
1. See which events are already tracked:
• Go to Reports → Engagement → Events
• You’ll see default events like page_view, scroll, etc.
2. Set up your own conversion event (e.g. newsletter signup):
• Go to Admin → Events → Create Event
• Set a condition like: event_name = click + element_id = subscribe_button
• Name it something like newsletter_signup
• Save
3. Mark it as a conversion:
• Go to Admin → Conversions → New conversion event
• Enter the exact name (newsletter_signup)
• GA4 will now treat this as a conversion
4. See which pages drive conversions:
• Go to Reports → Engagement → Pages and screens
• Click the ✏️ icon → Add metric: “Conversions”
• Apply → you’ll now see conversion counts per page
What to do with the data:
• Pages with high conversions:
→ These are your SEO MVPs. Promote them, refresh them, and link to them from other content.
(Identify by looking at “Conversions” metric in Pages and screens — anything with consistently high numbers is worth prioritizing.)
• Pages with high traffic but low conversions:
→ Improve your CTA: make it clearer, more visible, and relevant to the reader’s intent.
→ Offer something useful that fits the topic — like a free checklist, guide, or resource.
(Look for pages with high “Views” but low or zero “Conversions”. Ideally, you want at least a 1–5% conversion rate, depending on the offer.)
• Pages with no conversions at all:
→ You may not have tracking set up properly — or your CTAs might be too weak or hidden.
→ Fix the tech, then test stronger offers.
(Check “Conversions” column — if it’s blank across key pages, either tracking isn’t working or the page has no action to take.)
• Pages with high exit rates:
→ Visitors are leaving here instead of taking action or continuing.
→ Add a stronger CTA, link to related posts, or improve content flow to guide them forward.
(To find exit pages: Go to Reports → Engagement → Pages and screens, then add the “Exits” metric to the table. Pages with 50–70% exit rate are normal; above 80% may need a closer look.)
Why It Matters

Think of it like this:

 •  GA4 tells you what is happening: “This page has a 78% bounce rate” or “Only 40% of people engage.”

 •  Hotjar/Clarity shows you why it’s happening: “People aren’t scrolling past the hero image because it looks like a banner ad” or “Users keep clicking a non-clickable image.”


This context closes the gap between guesswork and action:

• You stop blindly rewriting copy
• You fix real UX issues
• You place CTAs where users actually look
When to use it:
• A page has high traffic but low conversion
• You fixed the copy, but bounce rate is still high
• You’re unsure why CTAs or forms are being ignored
High-leverage Actions:
Watch 5–10 recordings of users on your worst-performing pages. You’ll see friction you can’t spot from GA4 alone.
• If less than 50% scroll past the hero → rethink the layout or copy
• If users rage-click or click on dead areas → fix broken UX
• If your CTA is being ignored → try a different placement, color, or wording
• Remove distractions: popups, sidebars, carousels that pull focus from your primary action
Tooltips:
This layer of insight doesn’t just improve UX. It feeds right back into better SEO performance by reducing bounce, improving engagement, and nudging more conversions.
Why it matters:

Search traffic doesn’t drop or explode randomly. It usually shifts gradually in the background.
Keyword rank tracking helps you see those shifts before your traffic graph moves. It tells you:

• What’s gaining momentum
• What’s quietly slipping
• Where you’re close to a breakout

This is especially important for high-value pages (like landing pages or lead magnets), where a jump from position #11 to #7 can double clicks.
What to Track:
To stay ahead of traffic drops or catch ranking wins early, track how your most important keywords are moving over time.
Here’s what to focus on:
• Top 25 → Top 10 shifts
→ These show which keywords are getting close to page 1 — push them over the edge with small updates
• #11–#15 hoverers
→ Pages stuck just off page 1 — perfect for quick wins like stronger intros, better formatting, or added internal links
• Lost rankings (especially on money pages)
→ Pages that used to rank well but slipped — these need to be refreshed and rescued fast⸻
How to Track It:
• Pick 20–30 high-value keywords
→ Your keyword research should already have these — focus on core topics, product-related terms, or lead magnet phrases
• Track their positions bi-weekly or monthly. Use tools like Ahrefs, Ubersuggest, SEO PowerSuite, or SERPWatcher. The simplest to start using for Keyword Ranking Tracking seemed Mangools:
What to do with the data:
• Keywords hovering at #11–#15?
→ Optimize the intro: make it stronger, match the keyword intent
→ Add LSI (related) keywords naturally into the text and subheadings
→ Link to the page from stronger internal pages using exact-match anchor text
→ Add visuals or FAQs to improve engagement and dwell time
• Keywords that dropped?
→ Check: has the content aged? Did competitors update theirs?
→ Refresh the content, improve on what others did better, and re-submit in GSC
• Keywords entering the top 10?
→ Celebrate — then make sure the meta title & description are optimized for CTR
→ Add internal links to boost stability
You don’t need 50 SEO metrics. You need the right few, tracked consistently, to drive real growth. The metrics and actions in this guide are your 90/10 levers: they surface the most impactful opportunities and remove the guesswork from your SEO strategy. You now know which traffic and engagement signals to monitor, how to track content performance and conversions, and what to do with ranking shifts and user behavior patterns. Next step? Set a recurring 60–90 minute block once a month. In that time, review your top SEO pages, identify low-hanging wins, and act on a few high-impact fixes. Do this consistently, and SEO becomes a compounding engine, not a guessing game.
 Loved the story? Share it to inspire others and spark new ideas!

 LinkedIn
 Twitter (X)
 Facebook
 Copy link


